Data Logging
I expanded the D-Lev librarian "stats" command to do automated data analysis and logging to screen and file. The raw unfiltered 32 bit pitch and volume operating points are read and processed once per second. The data is filtered via a boxcar moving average of width equal to the logging period, and 2nd order low pass filtered with user selectable cutoff for some extra smoothing. Running statistics are done on the unfiltered samples: average, standard deviation, and kurtosis. There is a user selectable start delay so one can move far away from the measurement area and things can calm down physically and capacitively before data collection starts.

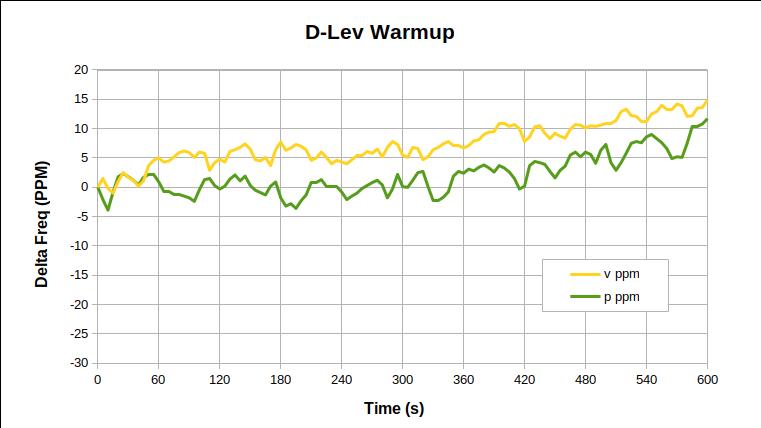
Above is my lab unit from cold start to 10 minutes. Graphing it too much longer would probably just show variation with room temperature and such, I was mainly interested in the start-up drift.
With a sample rate this low, the possibility of serious aliasing rears its ugly head. But I'll mainly be using this to test the stability of units before they are shipped, and perhaps to help diagnose any field issues.
This was an interesting exercise, I learned a fair amount about statistics, and now have an additional testing tool.
[EDIT] Kurtosis turned out to be rather useless, so it's been replaced by max - min.
[EDIT2] A video showing the logging function in action (skip to 10:00): https://www.youtube.com/watch?v=brEq_eKuyLk

